Percentage Increase and Decrease confronting time: how to Calculate and Interpret in an Analytics Tools
When analyzing data over different time periods, one of the key metrics to consider is the percentage increase or decrease. Percentage increase helps us understand the relative growth or change between two values, whether they are sales figures, population counts, or any other measurable quantity. In this post, we will explore what percentage increase is, how to calculate it, and how to interpret the results.
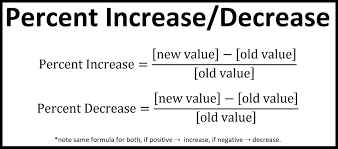
This method is useful and this is the way that GA4, Adobe or whoever analysis platform used to represent the data:
What is Percentage Increase?
Percentage increase, also known as percent increase, is a measure that quantifies the growth or expansion of a value from an initial point to a later point in time. It is commonly used in various fields, including finance, economics, and statistics, to evaluate changes over time.
Calculating Percentage Increase
The formula to calculate the percentage increase between two periods is straightforward:
Percentage Increase = ((New Period - Old Period) / Old Period) * 100Here's a step-by-step breakdown of the calculation:
Identify the Old Value: This is the starting value of the quantity you are analyzing.
Identify the New Value: This is the ending value of the quantity after a certain period.
Calculate the Difference: Subtract the Old Value from the New Value.
Divide by the Old Value: Divide the difference by the Old Value.
Multiply by 100: Multiply the result by 100 to get the percentage increase.
Interpreting the Percentage Increase
Understanding the percentage increase is essential for making informed decisions based on the data. Here's how to interpret the results:
If the percentage increase is positive, it indicates growth or expansion between the two periods.
If the percentage increase is negative, it represents a decrease or contraction.
The magnitude of the percentage increase reflects the extent of the change. A higher percentage increase signifies a larger growth relative to the initial value.
Example Calculation
Let's take a real-world example to illustrate the concept. Imagine you are analyzing the revenue of a company over two years:
Month 1 Organic User Acquisition: 674
Month 2 Organic User Acquisition: 635
Using the formula, the percentage increase would be calculated as follows:
Percentage Increase = ((674 - 635) / 635) * 100 = ( 39 / 635) * 100 = 0.0614 * 100 = 6.14%This indicates that the website Organic user acquisition increased by 6.14% from Month 1 to Month 2.
Conclusion and Suggestions
Percentage increase is a valuable tool for evaluating changes over time, whether in business, economics, or Analytics any other field involving data analysis.
By calculating and interpreting the percentage increase, you gain insights into the relative growth or decline of a quantity between two periods.
Remember that a positive percentage increase signifies growth, while a negative value indicates a decrease. So this is the SAME formula!
Incorporating this calculation into your analytical toolkit empowers you to make well-informed decisions based on historical data.
Do not have any confusion between the period of time and two numbers/values
Most Digital Marketer make huge confusion to calculate the increase or decrease of two numbers, but not considering the evaluation between time, digital is a fundamental constant
In the fast-paced world of digital marketing, understanding the nuances of data analysis is paramount. Among the essential concepts is calculating percentage increase or decrease between two numbers. Yet, all too often, this calculation is approached without due consideration for the time factor, a fundamental constant in the digital landscape.
Interpreting with Temporal Context
The true power of factoring in time emerges during interpretation:
Positive Percentage Increase: This signals growth. In the digital context, understanding the timeline over which this growth occurred is pivotal. Was it a rapid surge over a short period or steady growth over months?
Negative Percentage Increase: A decrease in numbers might seem negative, but by considering time, marketers can discern whether this dip is part of a cyclic pattern or a concerning trend.
Examples - Scenario:
Consider a scenario where a digital campaign's website traffic increased:
Month 1 Traffic this year or actual period: 15,000 visitors
Month 2 Traffic last year or compared range: 10,000 visitors
The conventional percentage increase is 66%. (10k/15k * 100)
Yet, when we factor in time, knowing this growth occurred over a single month paints a different picture:
Percentage Increase = ((15.000 - 10.000) / 10.000) * 100 = 50%
By recognizing the significance of time, digital marketers can better interpret these percentages, translating them into insights that mirror the ebb and flow of the digital landscape.
Calculate Increase and Decrease over time in different scenarios and languages:
Php
<?php
// Define your Old Value and New Value
$oldValue = 100;
$newValue = 150;
// Calculate the percentage increase

$percentageIncrease = (($newValue - $oldValue) / $oldValue) * 100;

// Print the result
echo "Percentage Increase: " . $percentageIncrease . "%"; ?>
Javascript
// Define your Old Value and New Value
var oldValue = 100;
var newValue = 150;

// Calculate the percentage increase
var percentageIncrease = ((newValue - oldValue) / oldValue) * 100;

// Print the result
console.log("Percentage Increase: " + percentageIncrease + "%");
Phyton
# Define your Old Value and New Value
old_value = 100
new_value = 150

# Calculate the percentage increase
percentage_increase = ((new_value - old_value) / old_value) * 100

# Print the result
print("Percentage Increase:", percentage_increase, "%")


