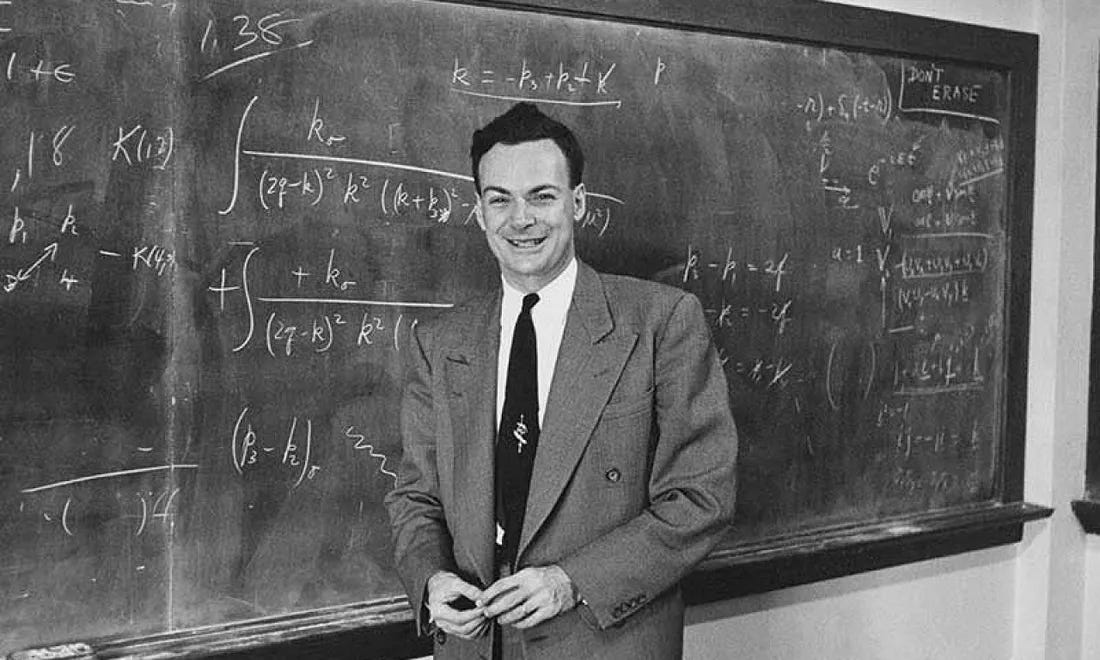
How to master the art of learning: Feynman Technique
In our quest for knowledge, we often encounter complex topics that seem beyond our grasp.
However, one method stands out in its simplicity and effectiveness for truly understanding and retaining new information: The Feynman Technique is one of the best methods to learn new information.
Named after the renowned physicist, Richard Feynman, this technique is both an enlightening and humbling process, reminding us that true understanding lies in simplicity.

Who Was Richard Feynman?
Before delving into the technique, it's essential to know a little about the man behind it.
Richard Feynman was an American physicist who made significant contributions to quantum mechanics and quantum electrodynamics. He was awarded the Nobel Prize in Physics in 1965, but beyond his academic achievements, Feynman was known for his infectious enthusiasm, insatiable curiosity, and unique ability to explain complex subjects in an understandable manner.
This passion for teaching and clarity gave birth to the Feynman Technique.
Breaking Down the Feynman Technique
The Feynman Technique can be distilled into four main steps:
Choose a Topic and Study It: Begin by immersing yourself in a subject, reading and absorbing as much as you can.
Teach It to a Child: This step is the crux of the technique. Try explaining the topic as if you were speaking to a child. Avoid jargon and ensure your explanation is concise and straightforward. This process will force you to distil the topic down to its core essence.
Identify Gaps in Your Knowledge: While teaching the topic, you'll likely stumble upon areas where your understanding is shaky. This recognition is beneficial because it pinpoints exactly where you need further study.
Review and Simplify: Once you've revisited your source material, try explaining the topic again, and streamline your explanation even more. This iterative process reinforces your understanding.
The Power of Simplicity
The underlying philosophy of the Feynman Technique is that if you can't explain something simply, you don't truly understand it. While this might seem daunting, it's also liberating, the method pushes us to break concepts down to their foundational principles.
And in doing so, we often find that many complex ideas are built on relatively simple underlying principles.
Applications Beyond Study
While the Feynman Technique is a study method at its core, its principles can be applied to various areas of life:
Problem Solving: When faced with a complex problem, breaking it down into simpler terms can lead to more effective solutions.
Communication: In professional settings, being able to explain concepts simply can make you a more effective communicator, especially when dealing with non-experts.
Self-reflection: The technique can also be used as a tool for introspection. If you're grappling with a personal issue, try explaining it simply to yourself or someone else, and you might gain new insights.
Data Discovery - Apply the Feynman Technique
Data discovery is the process by which businesses use tools and strategies to visualize vast amounts of data and derive meaningful insights from them.
Let's break down how one might use the Feynman Technique to understand and explain a particular aspect of data discovery: the concept of "data visualization."
1. Choose a Topic and Study It:
Let's say you're learning about "data visualization" within the context of data discovery.
You'd begin by reading books and articles or watching videos on the topic. You'd explore different types of visualizations, their purposes, and the tools used to create them.
2. Teach It to a Child:
Now, imagine you're explaining data visualization to a child:
"Imagine you have a big box of colourful LEGO bricks.
Each brick represents a piece of information or data.
Instead of telling a friend about each individual brick, you decide to build something with them. Maybe you make a tower where each level shows how many of each colour you have.
Now, instead of trying to imagine all those bricks separately, your friend can just look at your LEGO tower and easily see which colour you have the most of.
That's what we do with data visualization – we turn lots of pieces of information into pictures so that they're easier to understand."
3. Identify Gaps in Your Knowledge:
As you explain, you might realize there are parts of data visualization you're unsure about, like:
Why are some visualizations better than others for certain types of data?
How do different colours or shapes affect our understanding of the data?
Which tools are best for creating interactive visualizations?
These questions indicate areas where you need to return to your sources and delve deeper.
4. Review and Simplify:
After further research, you attempt to explain the concept again:
"Data visualization is like creating a map from numbers.
Instead of reading a long list of cities and their distances, a map shows you everything in a way that's easy to understand. In the same way, we take lots of numbers from our business, like sales or website visits, and turn them into charts, graphs, or other pictures. This helps people in our company quickly see patterns, like which products are selling the best."
Applying in a Real-World Data Discovery Context:
Now, when tasked with implementing a data visualization tool in your organization's data discovery process, you'd approach it with clarity:
Recognizing the importance of choosing the right visual representation (e.g., bar chart vs. pie chart).
Understanding the need to avoid visual clutter, ensuring that data is interpreted correctly.
Appreciating that the right visualization can lead to faster, better business decisions.
By breaking down the concept using the Feynman Technique, not only have you deepened your understanding of data visualization, but you're also better equipped to communicate its significance to colleagues or stakeholders.

